
Kate Kim
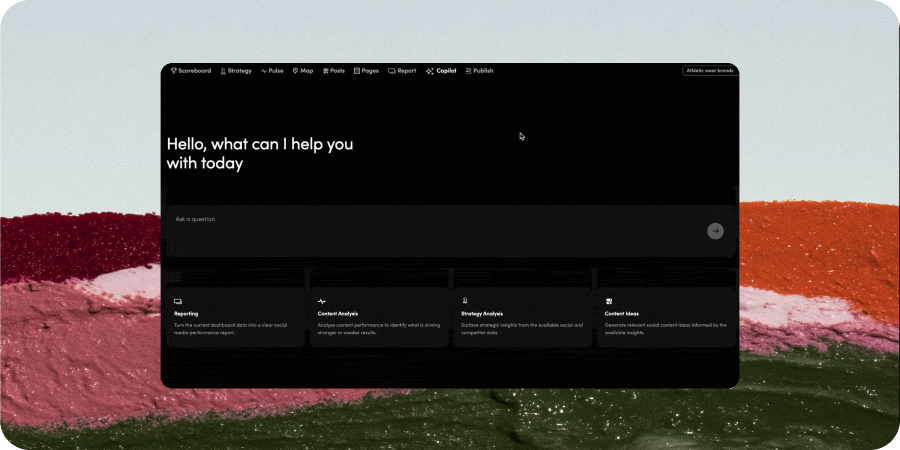
Zavy Copilot has always been designed to help you make more sense of your social performance. Now, we’ve made it much more useful so you can incorporate it into your existing workflows.
Based on feedback from the teams using Zavy every day, we’ve given Copilot a serious upgrade. It’s faster, more capable, and much more hands-on with your social data.
You can now use Copilot to pull the numbers you need to notice a trend, create reports and graphs, talk through what your performance is telling you and even turn those insights into ideas for what to post next.
Our vision was to make Copilot feel less like another tool you have to learn and more like an extra pair of eyes on your social data.
There are usually a few steps between spotting something interesting in your social performance and actually doing something about it.
First, you need to find the right numbers. Then you need to make sense of them. Then, if you’re reporting on performance, you need to turn them into something other people can understand.
And finally, you need to decide what they mean for the content you create next.
The upgraded Zavy Copilot can now help across that entire process.
Sometimes the hardest part of reporting isn't the analytics but simply finding the number you're looking for to hold up your claims.
Instead of working your way through dashboards or pulling together metrics manually, no, you can ask Copilot. Here's a couple of questions you can try asking that'll speed up your process in reporting metrics:
Ask the question and Copilot can help pull out the information you need with the numbers that are recorded in the system.
This elevates the experience from a quick performance scan to getting you the figures you actually need for a monthly report or a presentation, whether that's in front of your manager or the CMO.
The goal is to make the data already inside Zavy easier to work with.
Finding the number is one thing. Showing what it means is another.
Copilot can now help create reports and graphs across different KPIs, making it easier to turn social performance data into something you can share.
Instead of copying numbers into a spreadsheet and building a chart yourself, you can use Copilot to help visualize the pattern.
That could mean looking at:
It's particularly useful when the story isn't contained in one number.
A graph can make a trend obvious in seconds that might otherwise take several rows of data to explain. For social teams regularly preparing internal updates, campaign reviews, or stakeholder reports, that means less time assembling the information and more time discussing what it actually means.
This is where Copilot starts to become more than a reporting shortcut.
You can now use it to talk through the patterns behind your performance.
Because knowing what happened is useful.
Understanding why it might have happened is where the real value starts.
If engagement is rising, what appears to be driving it?
If one type of content consistently performs better, what does it have in common?
If a KPI suddenly changes, is there a pattern worth looking into?
Rather than staring at a dashboard and trying to connect the dots yourself, you can use Copilot as another way to explore the data.
Ask follow-up questions. Dig into something unexpected. Test a hypothesis or an observation.
Explore the pattern that caught your attention.
Think of it as an extra pair of eyes on your social performance, ready to help you work through what the numbers are telling you. Your team still brings the context, judgement, and knowledge of your audience. Copilot makes it easier to interrogate the data behind those decisions.
Your team still brings the context, judgement, and knowledge of your audience. Copilot makes it easier to interrogate the data behind those decisions.
The most useful insight is usually the one you can act on. That’s why Copilot can also help generate ideas for what to post next.
If your data shows a particular topic is resonating, you can explore ways to build on it.
If a format is performing strongly, you can ask for ideas that take that pattern further.
If you’re staring at an empty content calendar, you can use Copilot to help get the thinking started.
It creates a much more natural connection between analytics and content planning.
Instead of:
Report on what happened. Close the report. Start brainstorming again from scratch.
You can move from:
What happened → Why did it happen → What should we try next?
That’s the role we want Copilot to play.
You’ll also start seeing Copilot surface insights directly within areas of Zavy such as Pulse and Map.
By surfacing Copilot insights closer to where you’re already looking at performance, interesting changes and opportunities become easier to spot without having to go hunting for them.
You might notice something unusual and Copilot might help explain it. Then you can decide whether it’s worth digging into further.
It makes Copilot feel less like a separate destination inside Zavy and more like an assistant working alongside you as you analyze your performance.
Built from how our customers actually work
A lot of what’s new with Copilot came from listening to the people already using Zavy.
Teams wanted quicker access to their numbers. They wanted an easier way to turn those numbers into reports and visualizations. They wanted to be able to ask follow-up questions instead of simply looking at static metrics. And they wanted insights to help inform what they created next.
So those are the areas we focused on.
The result is a Copilot that can work alongside more of the social workflow:
Need a number? Ask Copilot.
Need to show the trend? Create a graph.
Want to understand what’s happening? Chat through it.
Wondering what to create next? Generate some ideas.
And increasingly, Copilot can help surface the interesting stuff before you even know what you got to ask.
Social teams already have plenty of first-party platforms for numbers. The challenge is turning those numbers into useful decisions that'll drive business outcomes. Whether that be a report, an explanation, a pattern worth investigating, or an idea worth trying, that's where the upgraded Zavy Copilot comes in.
Think of it as your social performance sidekick: an extra brain that can help you find what you need, understand what you're seeing, and work out what to do next.
So if you haven't tried the new Copilot yet, go ahead. Pull the numbers, build the report, and explore the insight. You might just find your next idea. Book your demo here.


.avif)